Smokies WeatherNet Logo

⚡ Severe Weather Center

⚠️ NOTICE: This Severe Weather Center is currently under development. For official weather warnings and forecasts, please visit NWS Morristown or NWS Greenville-Spartanburg.

⚠️ WEATHER ALERT

Loading current alerts...

⚡ Quick View

Instant situational awareness for the Smokies region
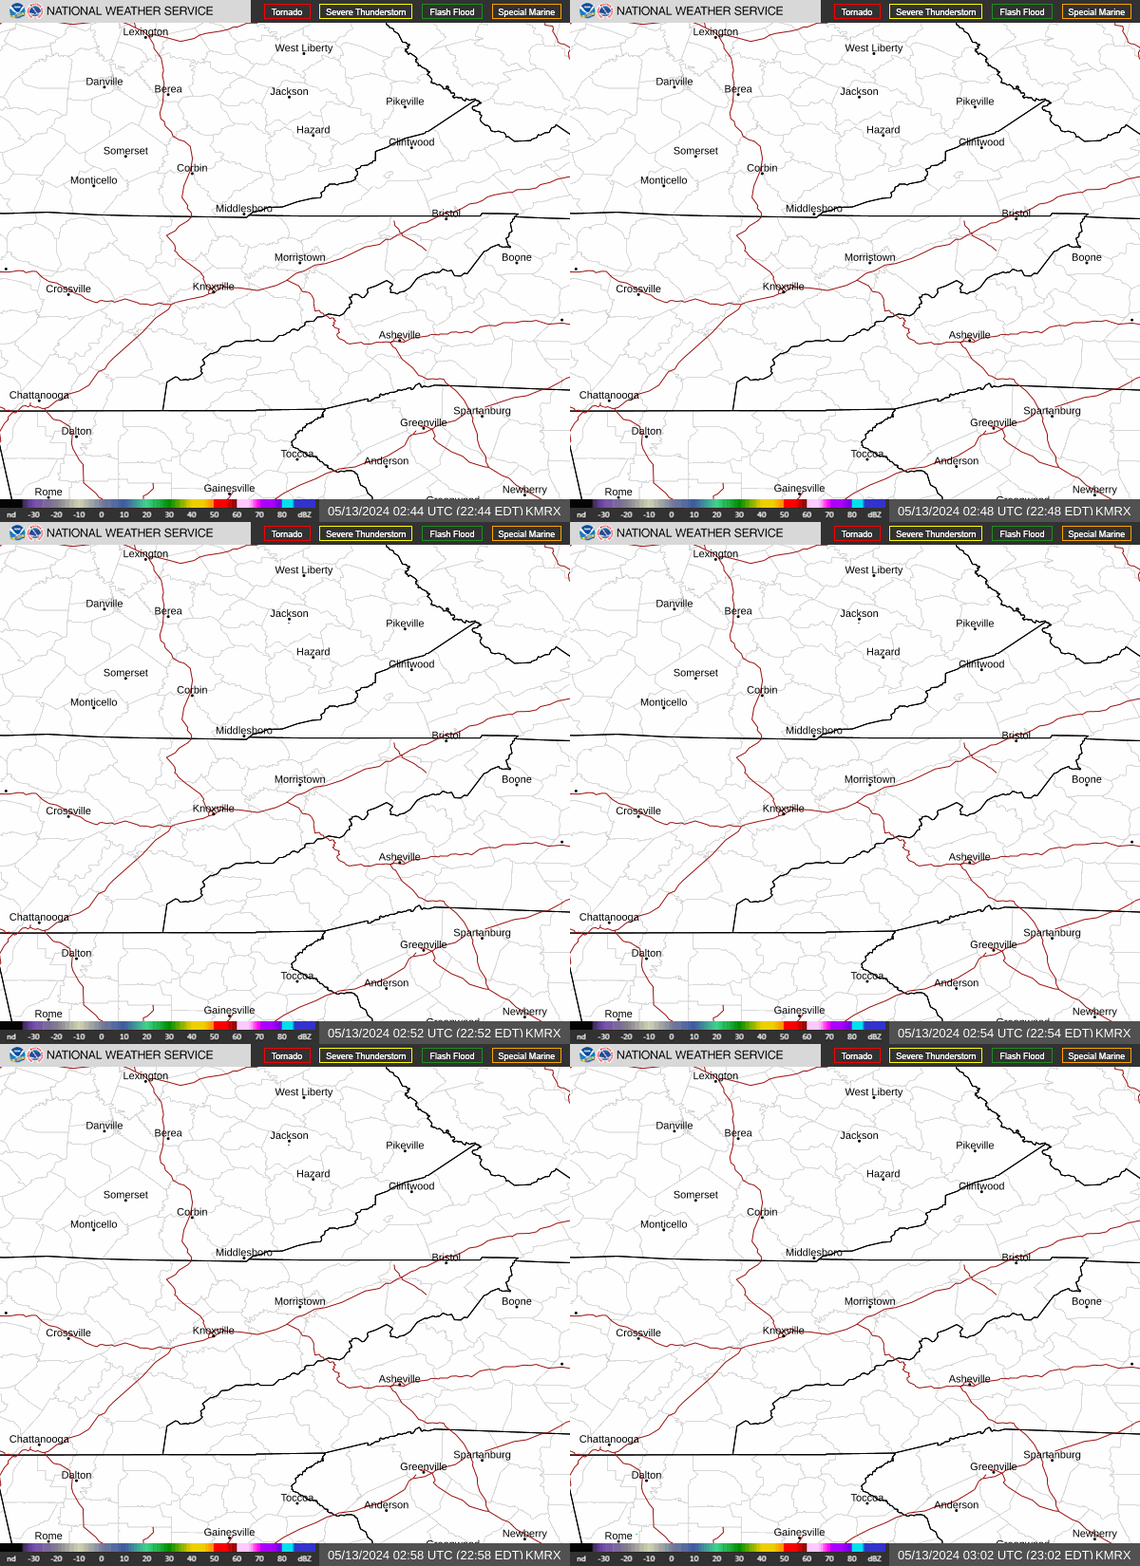
🚨 Active Alerts Map

🌧️ Regional Radar Loop

NWS Morristown Radar Loop

NWS Morristown (KMRX) | Updates every 2-5 minutes

THREAT CALCULATIONS DASHBOARD ©

🔧BETA🔧

Real-Time, Rolling 3 Hour Assessment for the Smokies Region

Loading threat assessment...

Weather Information

⚡ Lightning Detection

Real-time lightning strikes within 150 miles of the Smokies from Blitzortung community network.

Lightning data provided by Blitzortung.org community network

How to Use:

  • 🔴 Red strikes = Most recent (0-20 minutes)
  • 🟡 Yellow strikes = 20-40 minutes ago
  • ⚪ White strikes = Older (40+ minutes)
  • Zoom in/out with +/- buttons or scroll wheel
  • Click strikes for details (time, location)
  • Map updates automatically every 2 minutes

Powered by Blitzortung.org community lightning network

🔬 Research Radar

Advanced radar products for detailed storm analysis

💡 More products coming soon: Velocity, VIL, Precipitation Type, and Accumulation layers require upgraded radar service

Base Reflectivity: Shows precipitation intensity. Greens/yellows = light rain, reds/purples = heavy rain/hail.

Radar data from Iowa State University Mesonet

📍 Storm Reports

Today's severe weather reports from the Storm Prediction Center and local spotters.

Loading reports...

Loading storm reports...

Tornado
Wind Damage
Hail

Data from NOAA Storm Prediction Center | Updates every 10 minutes

🎯 SPC Outlooks

Storm Prediction Center convective outlooks - custom Smokies view

Marginal (1)
Slight (2)
Enhanced (3)
Moderate (4)
High (5)

Loading outlook data...

View Full SPC Outlooks →

⚡ Active Mesoscale Discussions

Loading mesoscale discussions...

Outlooks updated 4x daily (0100, 0600, 1300, 1630 UTC) | Auto-refresh enabled

📈 Technical Analysis

Advanced meteorological parameters for severe weather analysis.

🔬 Technical Analysis

Advanced parameters including CAPE, shear, helicity, and composite indices will be available here. This section will display SPC mesoanalysis data and proprietary Smokies-specific calculations.

Coming in Phase 2 development

View SPC Mesoanalysis (External) →

ℹ️ How to Use This Dashboard

🎯 Threat Level Scale (0-5)

Each threat is rated on a 5-point scale representing increasing likelihood and severity:

0.0
None
No threat expected
1.0
Minimal
~20% chance
Isolated impacts possible
2.0
Moderate
~40% chance
Scattered impacts likely
3.0
High
~60% chance
Widespread impacts expected
4.0
Severe
~80% chance
Imminent and severe
5.0
Extreme
~100% chance
Imminent, severe to catastrophic

📊 How to Read This Dashboard

  • Cards: Show the highest current threats across the region, in order of severity
  • Hour 1, 2, 3: Rolling 3-hour forecast showing how threats evolve
  • Valley / Foothills / Mountains: Threats broken down by elevation zone
  • Arrows (→): Indicate increasing (↗) or decreasing (↘) trends
  • Valid Time: When the forecast applies (always in the future)

🏔️ Elevation Zones

Valley

890-1410 feet

Vonore, Chestnut Hill, Greeneville

Foothills

1919-2230 feet

Tellico, Whittier, Seven Mile Ridge

Mountains

5699-6605 feet

Balsam, Clingmans Dome

🔄 Update Information

  • Update Frequency: Every 20 minutes (:09, :29, :49 of each hour)
  • Data Source: RAP (Rapid Refresh) numerical weather model
  • Forecast Horizon: 1-3 hours ahead
  • Resolution: 13km horizontal grid, 8 sampling locations

⚠️ Important Notes

  • This is an experimental system in beta testing
  • Not a substitute for official NWS warnings and forecasts
  • Threat levels are guidance only - not official forecasts
  • Mountain weather can change rapidly - stay alert to conditions
  • Always follow NWS warnings and local emergency management guidance